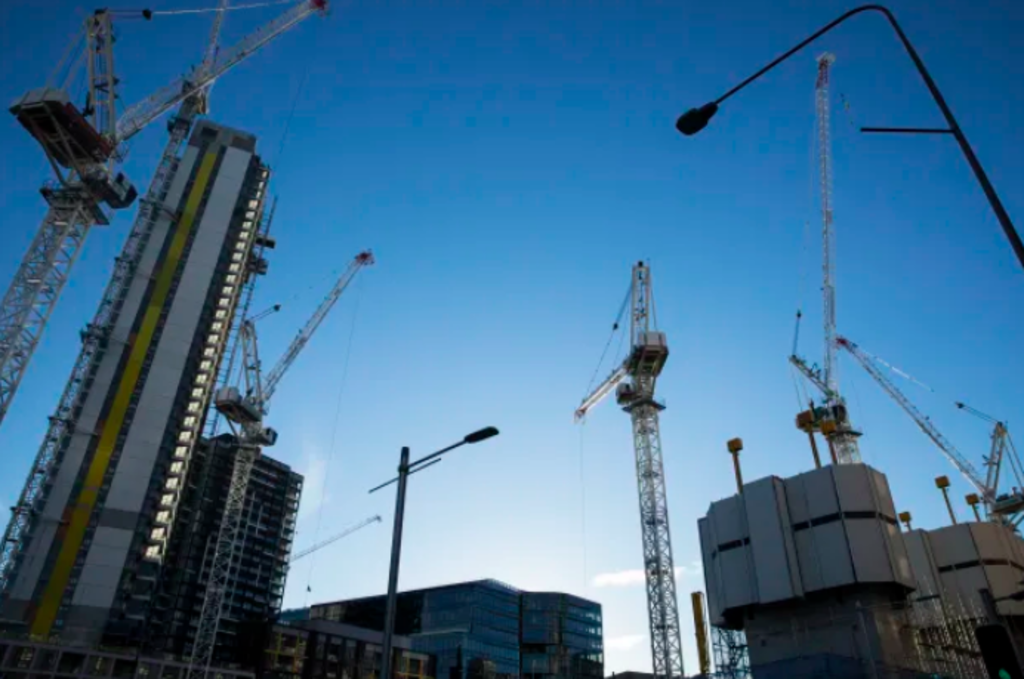
Crane numbers rise to record 868 - boosted by delays
New residential and commercial projects, along with delays that held back completion of existing work, have lifted the number of cranes across Australia’s skylines to a record 868, the latest RLB Crane Index shows.
Tower cranes used in high-rise apartment projects increased to 535, their highest number in 2½ years and those on non-residential commercial projects rose to a record 333, the Q3 2022 report shows.
Sydney’s tally rose by 32 cranes to a new high of 380, Melbourne gained 14 to 206 and Brisbane ticked up 3 to 82.
Residential cranes rose by 30, partly reflecting the increase in public housing work such as Victoria’s renewal of stock under ground-lease projects in suburbs such as Brighton and Flemington, while commercial numbers were boosted by projects including the Western Sydney Airport construction and Sydney Fish Markets redevelopment.
But the latest half-yearly count was kept higher by a fall in the so-called churn rate of cranes on construction sites, as bad weather, material and labour shortages slowed projects and left cranes on site longer than would otherwise be the case.
“Whilst this strong number shows the continuing resilience of our industry, projects are also being delayed due to increases in inclement weather events, shortages of materials, and lack of skilled labour,” said Domenic Schiafone, RLB Oceania head of research and development.
“If cranes providing logistical assistance to multi-storey developments remain on site longer than anticipated due to weather events and supply chain disruptions, the cost of preliminaries increase, causing overall costs to rise.”
Sydney, which increased its share of the national crane total to nearly 44 per cent, has also suffered the biggest slowdown since the pandemic began.
The Crane Index shows the churn rate – the number of cranes removed in a period, divided by the closing number of cranes, and expressed as a percentage – in the NSW capital dropped from 49 per cent in Q1 2020 to just 24 per cent in the latest count.
Brisbane – a capital city also hit hard by flood-related delays, on top of supply chain challenges – suffered less of a slowdown, with its churn rate falling from 57 per cent to 32 per cent over the same period.
Melbourne slowed even less, down from 45 per cent to 32 per cent.
The report does not show which projects are delayed or quantify delays relative to predicted time on site. It only measures the turnover across a city.
But the extra delay does create cost. The daily cost of having a crane on site varies by project between $7500 and $12,500, to cover equipment costs, fuel, insurance and workers, RLB said.
The upheaval of the past 2½ years has created volatility in Australia’s construction industry that Roberts Co chief executive Alison Mirams this week said had pulled the rug from under the expectations on which many builders relied.
“If you’ve said to me, 2½ years ago, the construction industry would have been shut for two weeks I would have asked what you’re smoking. It just wasn’t on the radar,” Ms Mirams told The Australian Financial Review Property Summit.
“We knew what things cost, we could look at the [weather] data and accurately predict rainfall … It feels like at the moment we need to be clairvoyants to predict what’s going to happen.”
Private-sector developers were responding to higher costs and volatility by deferring projects, while government clients on infrastructure projects were trying to reduce the scope, or make them cheaper, said Jon Davies, CEO of the Australian Constructors Association, an industry group or the country’s largest commercial and infrastructure contractors.
“At the private sector level, the margins on some of these developments are pretty wafer-thin at the best of times,” Mr Davies said.
“With this uncertainty around cost increases at the minute a lot of those private-sector developers are sitting tight to see whether things settle down at all. The forecast of another La Niña isn’t helping”.


